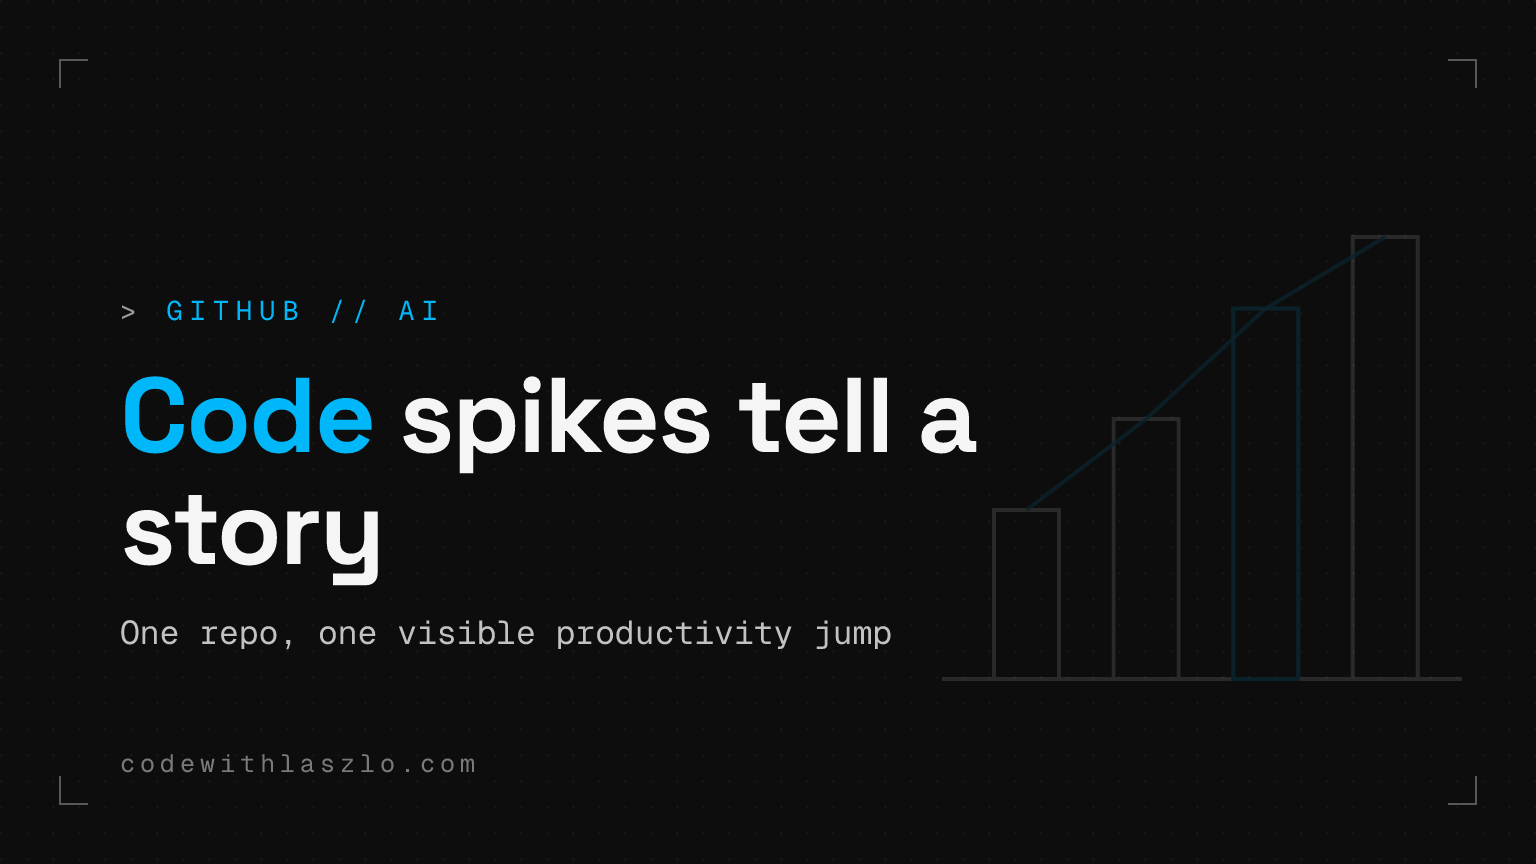
37,022 additions and 9,528 deletions in a single week is the kind of GitHub code frequency spike that makes you stop scrolling. That is the concrete reason this short note matters: for one well-known open source project, the jump in output after newer coding models is visible enough that you can see it on a repository graph.
This is not proof of software quality. It is not proof that AI wrote the code. But it is a useful artifact because it is simple, public, and harder to hand-wave away than vague productivity claims in a keynote.
What the chart is actually showing
The source points to the GitHub code frequency graph for Datasette, showing weekly additions and deletions over multiple years. The standout recent spike lands at 37,022 additions and 9,528 deletions. Simon links that burst of activity to newer coding tools and model classes, naming Opus 4.8, GPT-5.5, Fable 5 and GPT-5.6 Sol.
That does not mean the models deserve all the credit. A code frequency graph is blunt. It cannot tell you whether the work was architectural cleanup, generated scaffolding, experimental branches merged late, or a genuinely better development loop. It only shows that something changed materially in throughput.
Still, that is enough to make this interesting for engineering leads evaluating Microsoft Copilot and AI agents, or teams building their own custom MCP servers around internal tools.
Why this is more useful than most AI productivity claims
Most AI coding discussions collapse into anecdotes. Someone says they are 30% faster. Someone else says they lost a day cleaning up generated junk. Neither is very operationally useful.
A repository-level activity graph is not a benchmark, but it does give you a before-and-after shape. If you are experimenting with coding agents in a serious engineering team, this is one of the few lightweight signals worth tracking alongside the usual ones: PR cycle time, escaped defects, review burden, and how often humans are rewriting machine-produced code.
The second-order implication is the important one. If better models increase change volume, then review, testing, and release processes become the bottleneck. Teams that already have solid automation will absorb that extra output better. Teams without it will just create more half-reviewed change. That is where AI workflow automation starts to matter more than the model itself.
My take
I think this is a good example, but only as a signal, not a verdict.
The useful part is not the exact bar height. The useful part is that an experienced builder looked at his own repo history and found a visible inflection point. That lines up with what a lot of engineers are seeing privately: recent coding agents are not just better at autocomplete, they are changing how much code a single person can push through a project.
What I would not do is turn a chart like this into a finance case on its own. The community pushback around usage-based Copilot pricing exists for a reason: if output goes up but billing becomes unpredictable, the organization can still lose. More code is only a win if quality holds and the cost model is sane.
Practical takeaway: if your team is trialing coding agents, start collecting simple repo and delivery metrics now, before habits change. Otherwise six months later you will have opinions, but not evidence.